![]() kontakt@afdrtk.de
kontakt@afdrtk.de

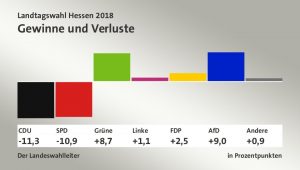
Ergebnisse der Landtagswahl vom 28.10.2018:

| Landesstimmen | ||||||||
|---|---|---|---|---|---|---|---|---|
| Art der Angabe | 2018 | 2013 | Veränderung zu 2013 | |||||
| Anzahl | % | Anzahl | % | Anzahl | %-Pkte. | |||
| Wahlberechtigte | 4 372 788 | – | 4 392 213 | – | -19 425 | – | ||
| Wähler/-innen | 2 942 846 | – | 3 216 206 | – | -273 360 | – | ||
| Wahlbeteiligung | – | 67,3 | – | 73,2 | – | -5,9 | ||
| Ungültige Stimmen | 61 585 | 2,1 | 85 425 | 2,7 | -23 840 | -0,6 | ||
| Gültige Stimmen | 2 881 261 | 97,9 | 3 130 781 | 97,3 | -249 520 | 0,6 | ||
| davon entfielen auf | ||||||||
| CDU | 776 910 | 27,0 | 1 199 633 | 38,3 | -422 723 | -11,3 | ||
| SPD | 570 446 | 19,8 | 961 896 | 30,7 | -391 450 | -10,9 | ||
| GRÜNE | 570 512 | 19,8 | 348 661 | 11,1 | 221 851 | 8,7 | ||
| DIE LINKE | 181 332 | 6,3 | 161 488 | 5,2 | 19 844 | 1,1 | ||
| FDP | 215 946 | 7,5 | 157 451 | 5,0 | 58 495 | 2,5 | ||
| AfD | 378 692 | 13,1 | 126 906 | 4,1 | 251 786 | 9,0 | ||
| PIRATEN | 11 617 | 0,4 | 60 159 | 1,9 | -48 542 | -1,5 | ||
| FREIE WÄHLER | 85 465 | 3,0 | 38 433 | 1,2 | 47 032 | 1,8 | ||
Detaillierte Wahlergebnisse des Rheingau-Taunus-Kreises:
Ergebnisse aufgeschlüsselt nach Gemeinden
Wahlkreis Rheingau-Taunus I (Wahlkreis 28) Erststimmen
Wahlkreis Rheingau-Taunus II (Wahlkreis 29) Erststimmen
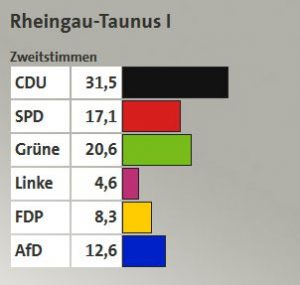
Wahlkreis Rheingau-Taunus I (Wahlkreis 28) Zweitstimmen
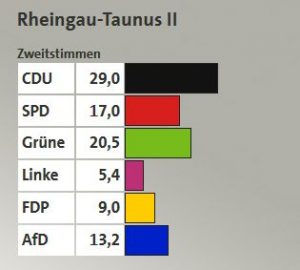
Wahlkreis Rheingau-Taunus II (Wahlkreis 29) Zweitstimmen